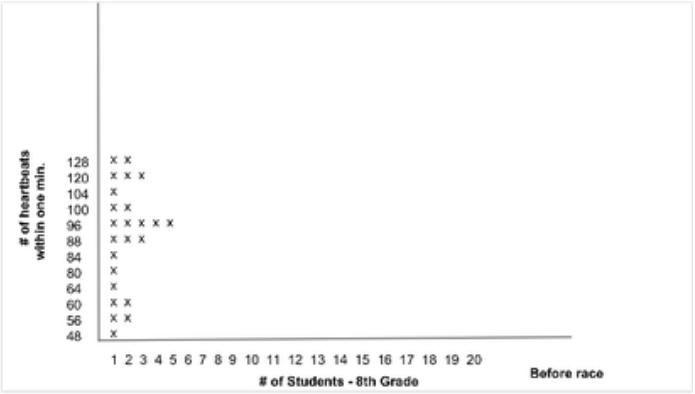
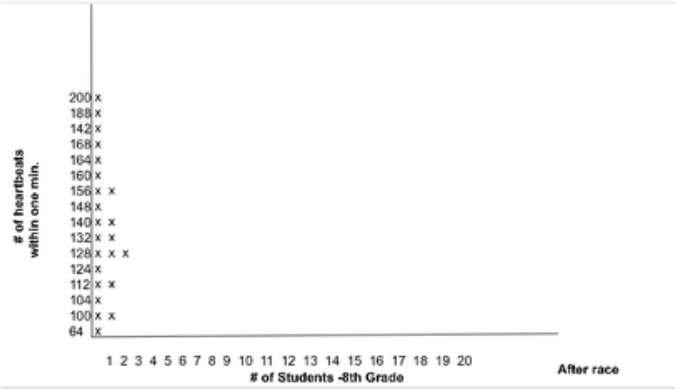
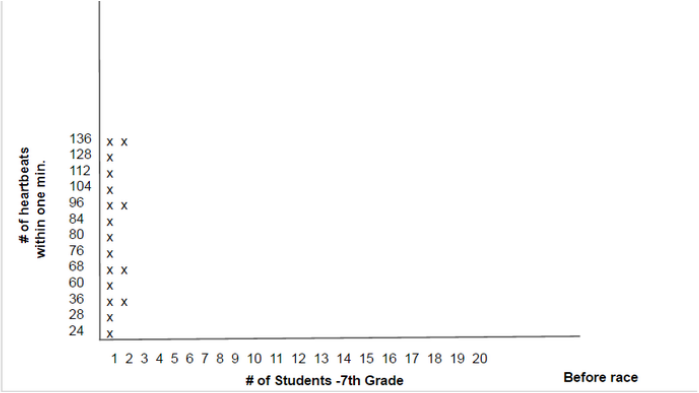
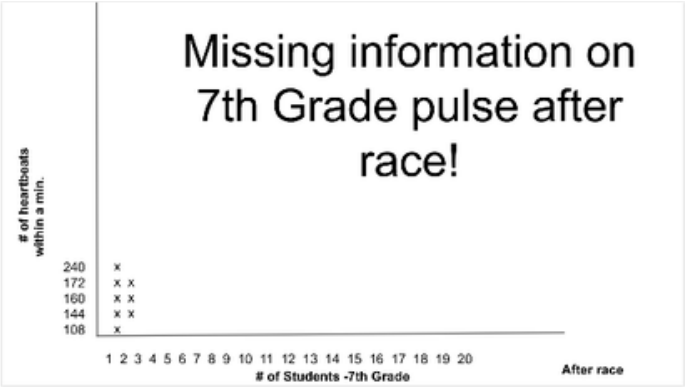
As you can see down below, there are images of the data we collected over the course of five days. During the summer program. The 7th and 8th graders in the program participated in a makeshift obstacle course in the gym. We collected the data by setting up a before and after comparison. We checked each individual's pulse before we allowed them to participate in the race. We wanted to see how much their heart rate would rise, while they were doing the obstacle course. After the students finished the course we immediately had the students check their own pulse to see what the after math results were. For this part of the course we had them check their own pulse to see if they actually understood what we were trying to teach them. Earlier that day we had presented a slide show on how to check your pulse manually.